Speaker
Description
Tokamak plasmas are mostly optically thin for visible radiation-emitting out of the plasma as the density of the emitter in the plasma is not sufficiently high to produced self-absorption of spectral lines in the visible region. However, in certain conditions, such as during pellet ablation inside plasma and massive gas injection signatures of absorption in the emission spectra might be observed, which can be very useful for comparison with radiative transfer modeling in fusion devices. One of the major outcomes of self-absorption is to determine the plasma opacity and to understand the self-absorption and prevailing density values. This is mostly happened for the spectrum having upper level with lower principal quantum numbers, which have greater line strengths [ref1]. Then, it is usually observed in the Ly-$\alpha$ emission as has been done in many high temperature plasma devices, such as large helical device [ref2].
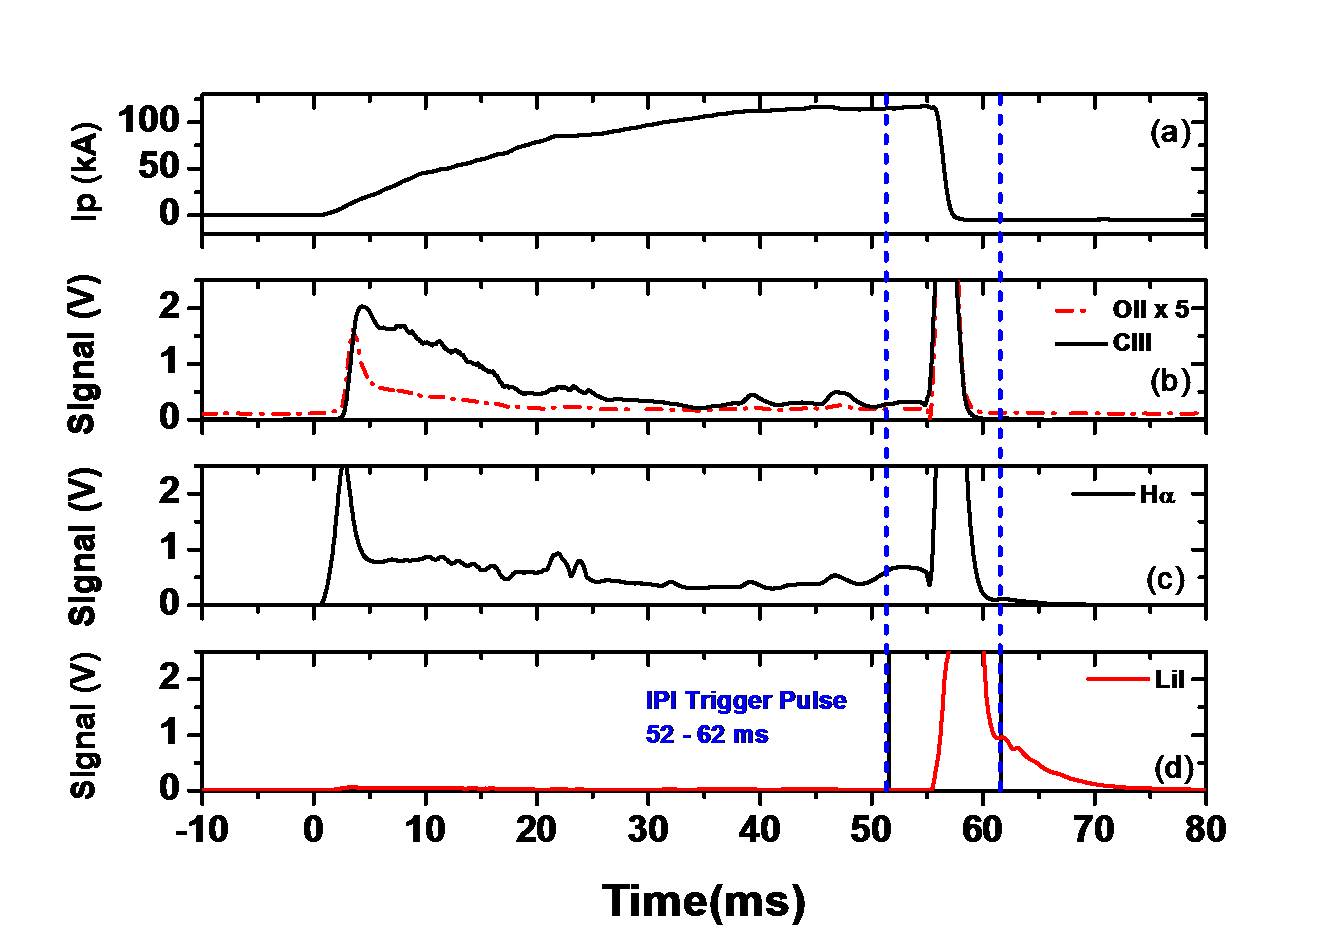
However, self-absorbed spectral lines other than hydrogen from tokamak emission in the visible range are not reported till now as per our knowledge. In Aditya-U tokamak, self-absorbed spectral line from neutral lithium has been observed for first time during recently carried out disruption mitigation experiment using a novel Inductive Pallet Injection system design, built and installed on Aditya-U tokamak [ref3]. With this system disruption mitigation experiment was carried out successfully by injecting few hundred milligrams of Li2TiO3 particle and resulting the quenching of the plasma in a few milliseconds through the intense radiation (figure-1). In this work, the detailed analysis of the self-absorbed spectral line are quantitatively evaluated using the radiation transport model to get the ground state lithium density and the atom layer thickness.
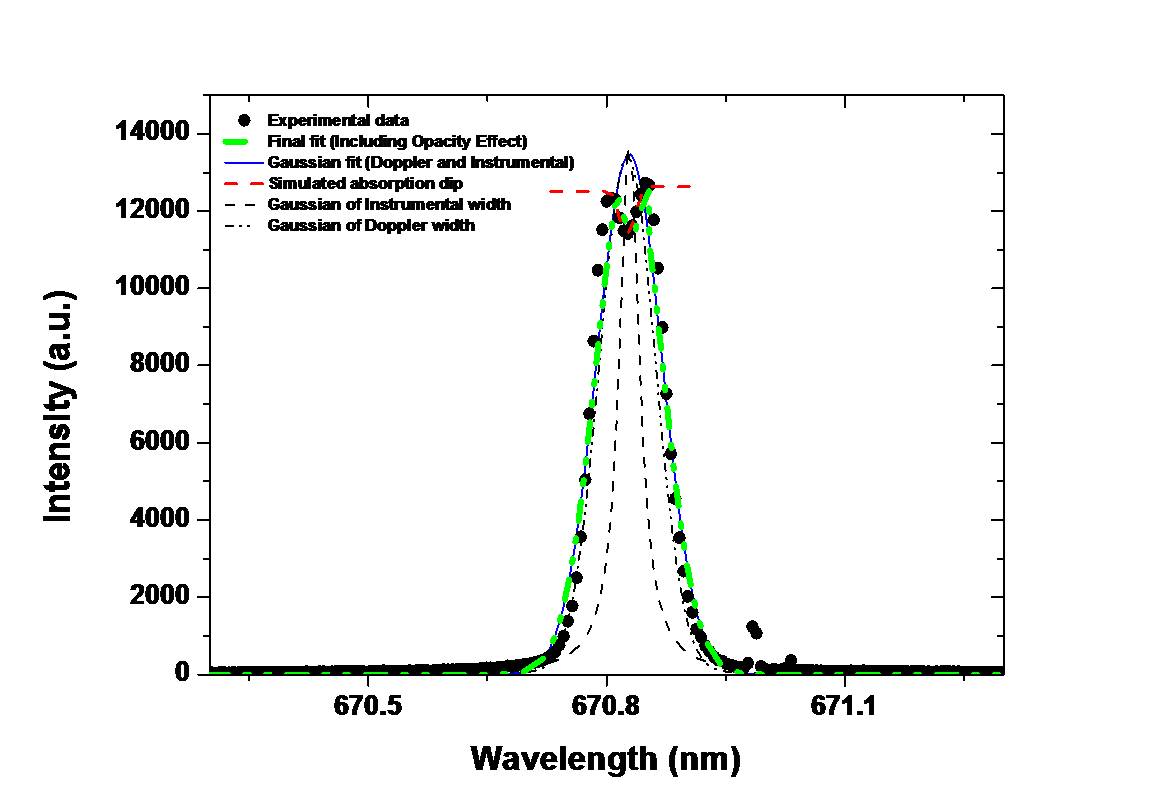
The Lithium neutral (670.8 nm 2s2S–2p2P)spectral line shape has been monitored during the disruption mitigation experiment using a space resolved spectroscopic system having capabilities to record the emissions from different lines of sight passing through various plasma radial locations was used to record the spatial profile of the radiation. The measurement system is having a 1 m long multi-track Spectrometer (MTS) and CCD detector with a reciprocal linear dispersion 0.0056 nm/pixel. During the time of disruption after the injection of particles, the recorded spectral line of the Li neutral showed a dip in intensity near its central wavelength. The spectral line shape is plotted in figure2. After thorough analysis of the spectral line-shape of the neutral Li, it has been concluded that the observed dip in the intensity near the line center in the emission spectra of Li is most likely related to the opacity effect due to the high density of lithium neutral during the time of the measurement. This observed spectral line-shape has been fitted with two Gaussian line profile one corresponding to emission spectrum and another corresponding to absorption spectrum. Figure2 shows the fitting of the observed spectral line by using a Gaussian profile corresponding to Doppler and Instrumental Broadening width along with a negative Gaussian profile present at near to the line center.
In this paper, the detailed investigation of the self-absorption of LiI spectral line emission has been carried out to understand the opacity effect. From this quantitative analysis using the radiation transport modeling the ground state lithium density and the atom layer thickness has been obtained. The absorption peak is also analyzed for obtaining the Li densities and its radial profile at the time of particles injection into the plasma during the disruption mitigation experiments.


References:
- Ghosh, J., et al. "Vacuum ultraviolet measurements on hydrogen resonance lines in the maryland centrifugal experiment." Physics of plasmas 12.3 (2005): 034501.
- Goto M. et al, Plasma Fusion Res. 5, S2089 (2010)
- Paper in this conference by R. L. Tanna et al
| Affiliation | The National Institute of Engineering, Mysuru |
|---|---|
| Country or International Organization | India |
