Speaker
Description
For tokamaks to be attractive as the core of future fusion based power plants, it must operate in steady state or at least quasi-steady state without plasma current disruptions. As is evident from the predictions for ITER based on present day tokamak research, a major challenge would be to avoid disruptions in majority of plasma discharges with full plasma parameters achieving >99% good shots. Or, in discharges where disruptions become unavoidable, one should be able to diagnose it early enough to take effective actions for mitigation of thermal and electromagnetic loads. Presently, major research and development efforts are underway in most fusion machines across the world to develop a robust mitigation technique that would be effective in ITER. This R&D would be very useful and may even decide parameters and operational space of future DEMO reactors. A critical aspect of disruption avoidance or mitigation is the early detection of an impending disruptive event, long enough to take corrective measures. Generally disruptions can occur in tokamaks due to a variety of reasons, e.g., plasma hitting density or q limits resulting in various MHD instabilities, core impurity accumulation, H-L mode transitions, loss of plasma position control and so on. Due to this multi-dimensional nature of the problem, it is often difficult to simultaneously track all plasma and machine parameters for effective disruption prediction. Perhaps a better way for effective predictions technique would be based on machine learning technique, which has received a lot of interest in recent times across all tokamaks [1-3].
Aditya is a small sized tokamak with modest plasma parameters (R/a=0.75m/0.25m, Ip(max)=0.25 MA, Bt=1.2-1.5T) and a circular, limited configuration. Still it is very effective for disruption studies. This paper describes a novel tool for quick data visualization and parameter selection for disruption prediction based on a machine learning technique applied on Aditya data. Recently Sharma et al. [4] have proposed convolution neural network (CNN) based binary classification scheme to classify disruptive and non-disruptive shots, building on a database of time series data of about 100 shots with 10 parameters of Aditya tokamak. This time series data is quantized, converted into 1000 images, and classification is performed using CNN. Their scheme achieved 91.22% mini-batch training accuracy in 500 epochs. We have selected a data set of 2000 Aditya discharges, which include both disrupted and non-disrupting ones for this study. The objective of our research is to develop a numerical tool for prediction of plasma disruptions based on state of the art machine learning algorithms applied on diagnostic data which will be compatible with the real time hardware based solution for avoidance or mitigation actions. To enhance the intuitive understanding and association of input data of disruptions, a 2D visualization tool has been developed. This uses color-coding of normalized parameters and decision surfaces projecting probable disruption space for offline and real time dataset. The system will be validated for time series prediction of plasma disruption. We have first used a sub-set of 1000 labeled shots, each having 156 recorded parameters (thus a total dataset of 156000), each shot with a sampling rate of 5000 samples per second. These shots are manually labeled in five shot-types of normal, disruption, no-discharge, small discharge and others. Preliminary investigation shows the database has a large redundancy of information for desired prediction of disruption and optimization of the number of parameters is required to reduce computation time. For this, we have designed an elaborated offline artificial neural network (ANN)-based correlation algorithm to compute the score of each parameter with respect to plasma current. Six top score parameters were found consistent with different combinations of above dataset. However, in second set of 1000 shots, shot-type information was not included. A shot-type classification model is developed using 25 sets of feedforward ANNs working concurrently using all samples of each parameter as input. The combined result of the ANNs predicts the shot-type with overall 96.5% accuracy, whereas share of disruption classification accuracy is 99.0%. This model is further applied to the second set of 1000 shots with unknown shot-type, where the results were validated by human expert with 99% accuracy. This is possibly due to the human error of sub-set one taken care by neural network.
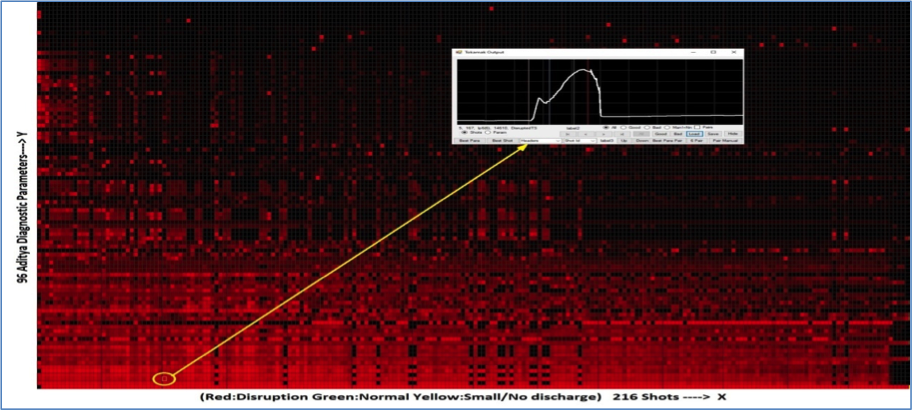
Each dataset of Aditya has its own characteristic like intensity, bandwidth, offset, life-cycle etc. Choice of ideal parameters for prediction needs multi-variable optimization over large number of shots. Visualizing the combined information at a glance is found useful for decision making. Information gain of each parameter is color-intensity coded to view in 2D plane. The viewing parameters are sorted along the X-Y axis such that the information density is highest to lowest across the diagonal as shown in Fig. 1, in which 20736 parameters are displayed with intensity coding cells representing information density. Each cell represents a parameter of a shot which can be viewed in a pop-up plot. The darker zone towards top-right corner represents low information area and the bottom-left corner, which is the area of interest, has high information gain intensity. The map is associated with the back-end database to view the parameter plot of each cell out of the 156000 samples. The display is further enhanced by color coding of the shot-type to increase the contrast between disruptive and normal shots. In these maps, the low information zones are dark and corresponding plots are flat. One of the important advantages of these maps is to locate missing data as a dark spot in high information density zone. These maps are very useful in identifying the right parameters for training using the ANN. Details of the above maps and preliminary results using this ANN tool will be presented in this paper.
References:
- William Tang et al, 2016, 26th IAEA Fusion Energy conference, 17-22 October, Kyoto, Japan, EX/P6-47.
- K.J. Montes et al 2019 Nucl. Fusion 59 096015
- Julian Kates-Harbeck et al, 2019, Nature, 568 (7753)
- Sharma, P. et al, 2018. “A proposed method for disruption classification in tokamak using convolutional neural network” in Towards Extensible and Adaptable Methods in Computing (pp. 179-193). Springer, Singapore.
| Affiliation | ITER-India, Institute for Plasma Research |
|---|---|
| Country or International Organization | India |